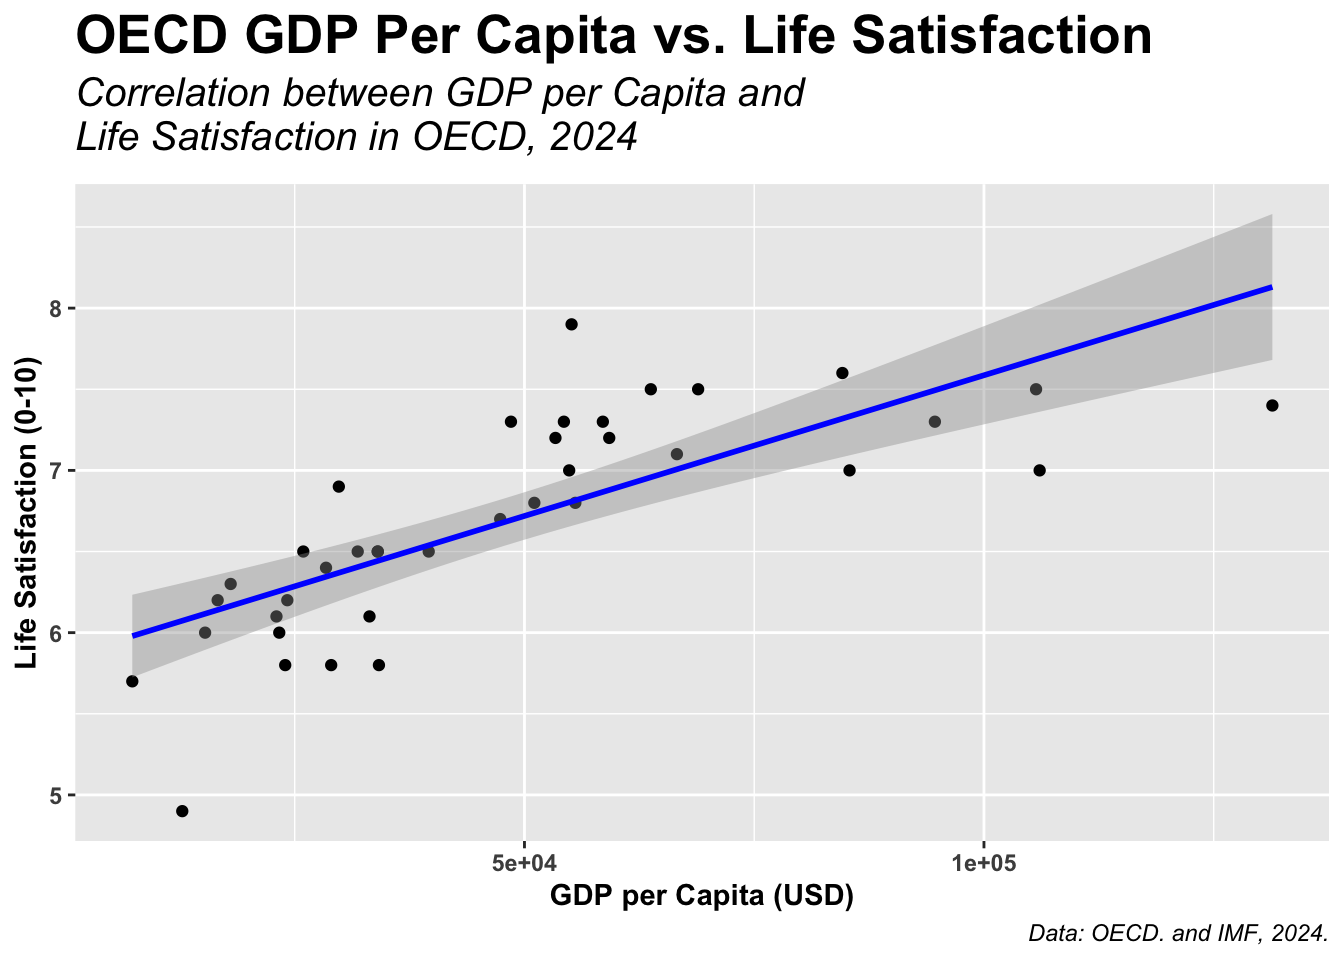
How does GDP Per Capita affect Life Satisfaction?
Analysis
This scatter plot shows that the OECD GDP per capita and Life Satisfaction levels correlate positively, as shown by the positive trend line. If you do not know, the “5e+04”, the E+n symbol, represents the preceding number (5) of E+, multiplied by 10 to the nth power.